The Shipping Forecast is primarily utilised by small fishing vessels. The users of the forecast could not be overlooked in my method of cataloguing, therefore it felt apt to map these routes in relation to my research.
Using data made available from the Government’s Department for Environment (2019), I pieced together a full map of the routes of small fishing boats in the waters surrounding the United Kingdom in 2019. This was the most recent set of data made available to the public. I then translated this information to speak to the graphical style of my research so far, specifically utilising sou’wester yellow.
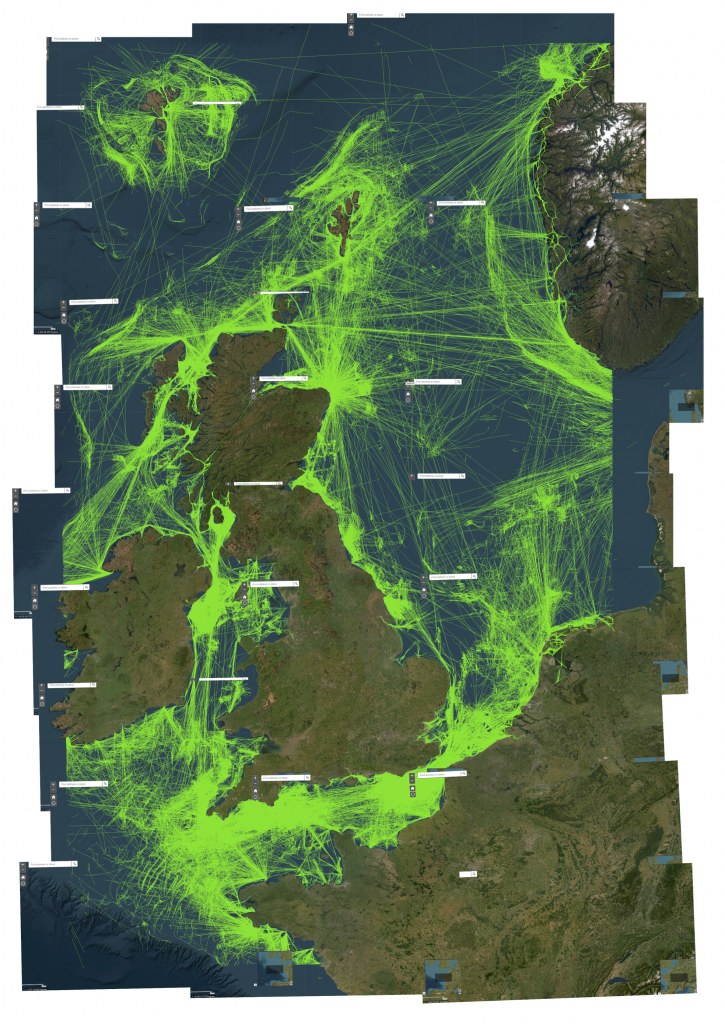
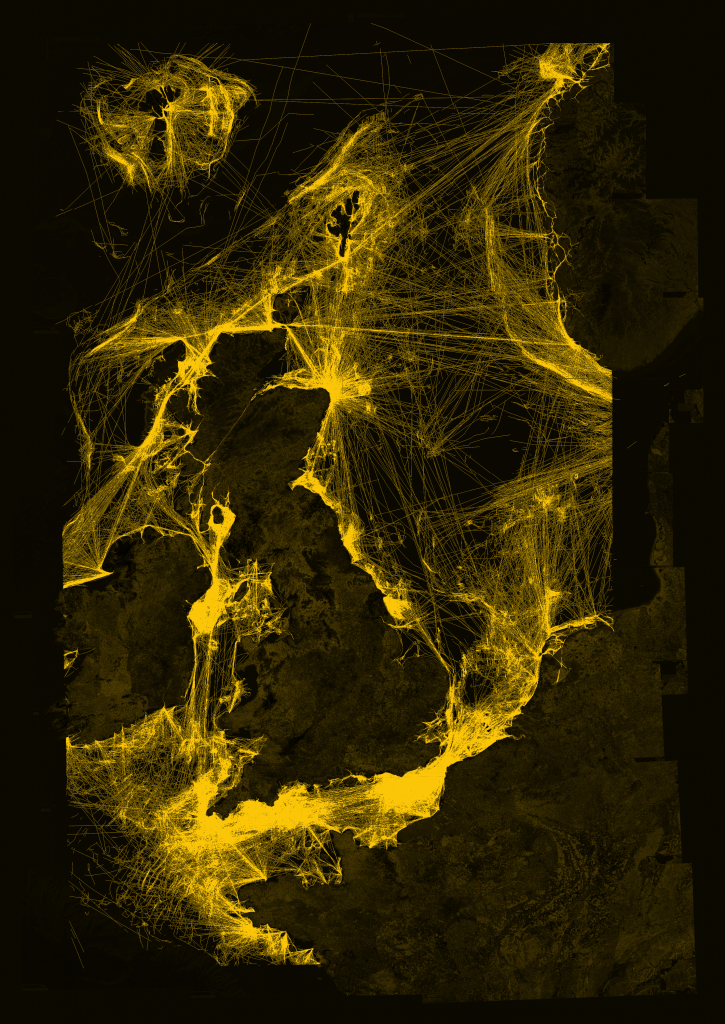
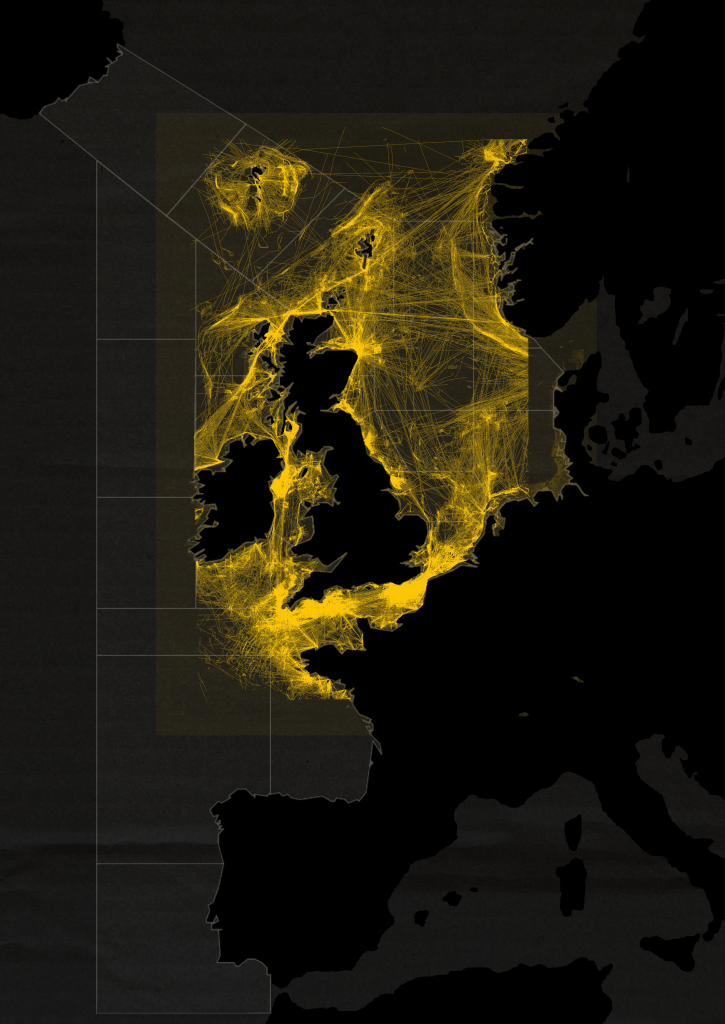
The fishing vessel map felt at odds with The Shipping Forecast map. It is important to note that the official Government data about shipping routes does not span the entire distance of The Shipping Forecast. South Iceland, Bailey, Rockall, Shannon and Trafalgar were not included in the expanse of the shipping vessel map. Furthermore, the lines of the shipping vessel map cannot be confined to the distinct zones of The Shipping Forecast map. This further reinforced my line of questioning: ‘What happens when you cross over the boundary of sea area zones?’
Reference List:
Department for Environment, Food & Rural Affairs (2019) ‘Shipping vessel density grid’. Shipping_Vessel_Density_Grid_2019. Available at: https://environment.data.gov.uk/explore/68d80192-89f6-400d-84b9-73478777df9b (Accessed 20 October 2025).
Leave a Reply